How an Intuitive Dashboard Provides Key Insights Into IoT Data

How an Intuitive Dashboard Provides Key Insights Into IoT Data

Introduction

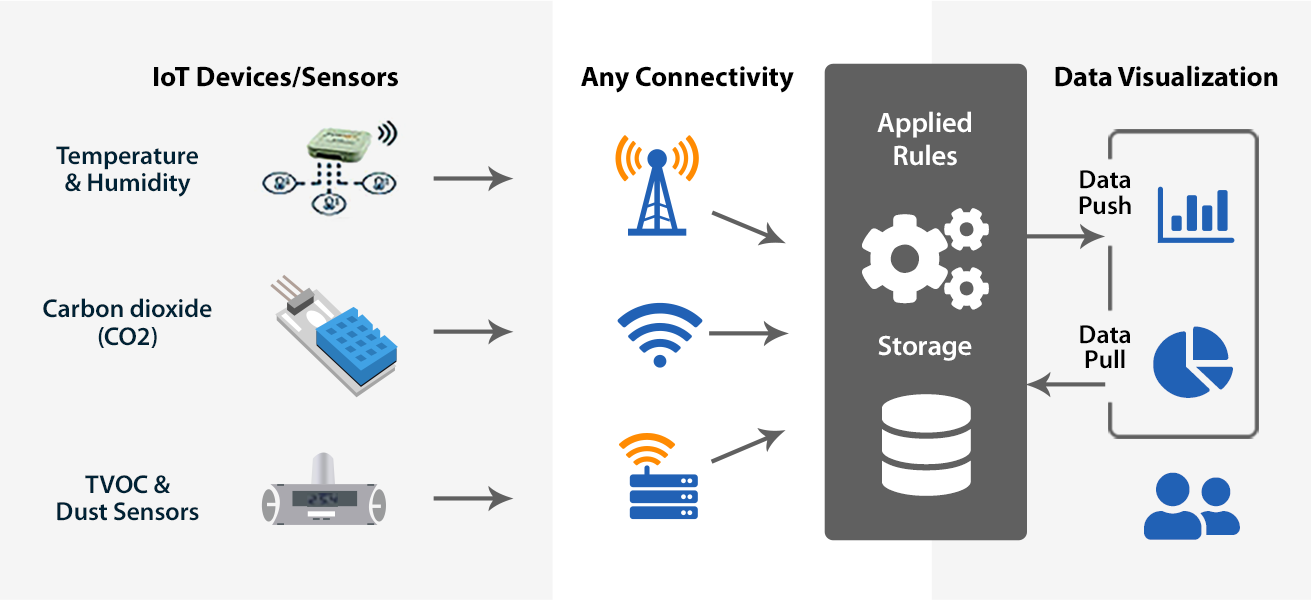
Digitalization is expected to bring in the next industrial revolution and the Internet of Things (IoT) is expected to be its foundational technology. While innovative sensors and wireless technologies are driving the evolution of the internet of things, the true business value of IoT lies in applying analytics and artificial intelligence (AI) than that originating out of hardware innovations.

IoT data involves datasets generated by sensors, which are now both inexpensive and sophisticated enough to support an apparently limitless variety of analytics and artificial intelligence use cases.

Customer Background Customer Background

  • Our client is a famous Swiss brand, known for providing quality product engineering excellence to hospitality industry to tackle air pollution problem head-on and give its esteemed guests/ clients access to certified pure quality air. The client has an edge over the others in the industry, when it comes to providing premium guest experience with real-time air quality monitoring thereby enabling the top-star user hotels to increase their guest satisfaction ratings.
  • The client has an edge over others in the industry, when it comes to providing premium guest experience with real-time air quality monitoring thereby enabling the top-star user hotels to increase their guest satisfaction ratings.

Requirement Requirement

  • The client was seeking an economically viable solution for providing critical insights into air quality, interpreting steady stream of data received from air quality, temperature, humidity and other sensors installed at various locations in the hotel facilities.
  • With the help of intuitive dashboards, client wanted to provide actionable insights to their hotel guests/ clients which would highlight areas of improvement across key measurement areas.

Scope Scope

  • The scope of the work was to design a cloud-based architecture to ingest streaming IoT data from several sensor devices. This data was then to be visualized in Power BI to get important visualizations and reports which could be referred by the executive management and operational management stakeholders.
  • The challenge was to implement data cleansing to avoid unwanted and hypothetical readings ( usually generated out of human or machine/ sensor errors), apply appropriate calibration rules to help management easily understand various measurements including air quality index, temp, humidity, CO2, PM10 and TVOC levels

Solution Solution

An extensible architecture was put in place where the data was collected from a handful of IoT devices and sensors.

  • The work was two-fold, one-time import of historic data that was in the form of .CSV files as well as ingesting live streaming data from the sensors in SQL server located in Azure cloud.
  • For analytics purposes, Azure analysis services were put into place that would fetch the data from the SQL server and analyze it further.
  • This processed data was then pushed to Power BI interface to generate appropriate dashboard visualizations and reports.

Business Benefits Business Benefits

  • The solution provided an easy to use and intuitive platform to monitor the “real-time” sensor data for avoiding unforeseen risks from poor air-quality conditions.
  • This also enabled better analysis of significant measurements across key areas and helped the management in having control over the operations costs.
  • The end- client was able to take appropriate measures to maintain the highest level of air-quality in and around their premises thereby providing highest quality of pure air all the time in and around their premises.
Infographic