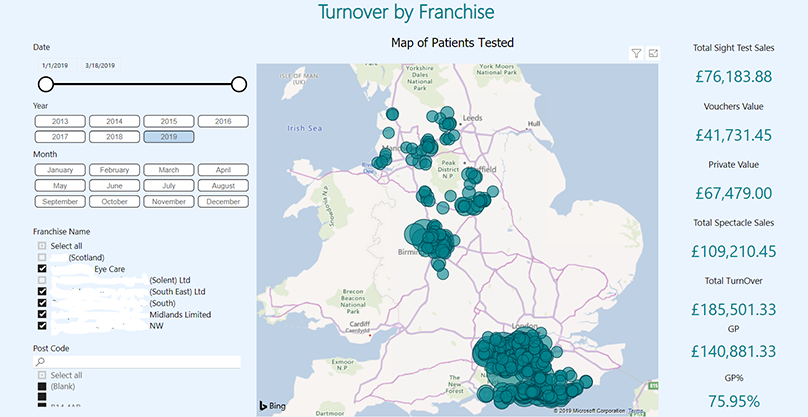
How an intelligent Dashboard provides key insights into operational costs
As commercial organizations start experiencing rapid growth, executive management faces unique challenges obtaining and monitoring key insights into organization wide operations. Operational data and information could be complex, and the management need a visualization solution that would simplify analysis while providing a variety of visualizations to help analyze changes in business variables.
 Customer
Background
Customer
Background Requirement
 Scope
Scope Solution
 Business Benefits