Providing Actionable Insights into Food and Beverages Operations

Providing Actionable Insights into Food and Beverages Operations

Introduction

Technology may not be the only thing unlocking new possibilities for the food and beverages (F&B) industry, but it is proving to be a major driving force. The food industry has seen technology impact through applications that enable new forms of e-commerce, operations tracking, managing supply chains, forecast production needs, and more. This is even more relevant for startups in the F&B domain as they start to experience rapid growth, executive management faces unique challenges of obtaining and monitoring key insights into organization wide operations.

Customer Background Customer Background

  • Our client is a well-known North America based privately held company that produces nutraceutical products primarily in powder, shake, and bar forms.
  • The company developed a following initially in the USA and received early financial backing from the investment arm of a large multinational conglomerate holding company and a venture capital firm.
  • The F&B products are available for purchase and shipment within the United States and Canada via both online and offline channels across 7-Eleven, Walmart, Target, Kroger, and Meijer stores.

Requirement Requirement

  • The client was seeking an easy and intuitive way of obtaining actionable insights into marketing spend, revenue growth, supply chain operations, for taking informed decisions.
  • The top management wanted to leverage such an analysis to increase the company revenues. Optimize marking spend and improve overall growth in profits.
  • They wanted to track business performance across the online and offline channels, across geographies within USA and Canada.

Scope Scope

  • The scope of the work included designing and deploying analysis, and AI driven solution for obtaining data from
    • Oracle NetSuite (a cloud-based ERP storing financials, CRM, and ecommerce related data),
    • Shopify (an e-commerce platform for online stores and retail point-of-sale systems),
    • Amazon Redshift (cloud-based data warehouse storing aggregated data for orders & shipments) and
    • a pile of Excel sheets used for operational purposes.
  • The solution needed to combine relevant data from these sources and model it for deriving insights.
  • It was also expected that modelling should be applied to discover major trends.
  • Based on the data that is collected, Aress needed to build intuitive data visualizations to help comprehend the information.

Solution Solution

  • Aress assigned a team of data analysts and developers to work on designing and deploying a scalable data model-based architecture.
  • The developers designed and deployed data pipelines to extract and combine data from relevant data sources.
  • Marketing analysis covered areas including –
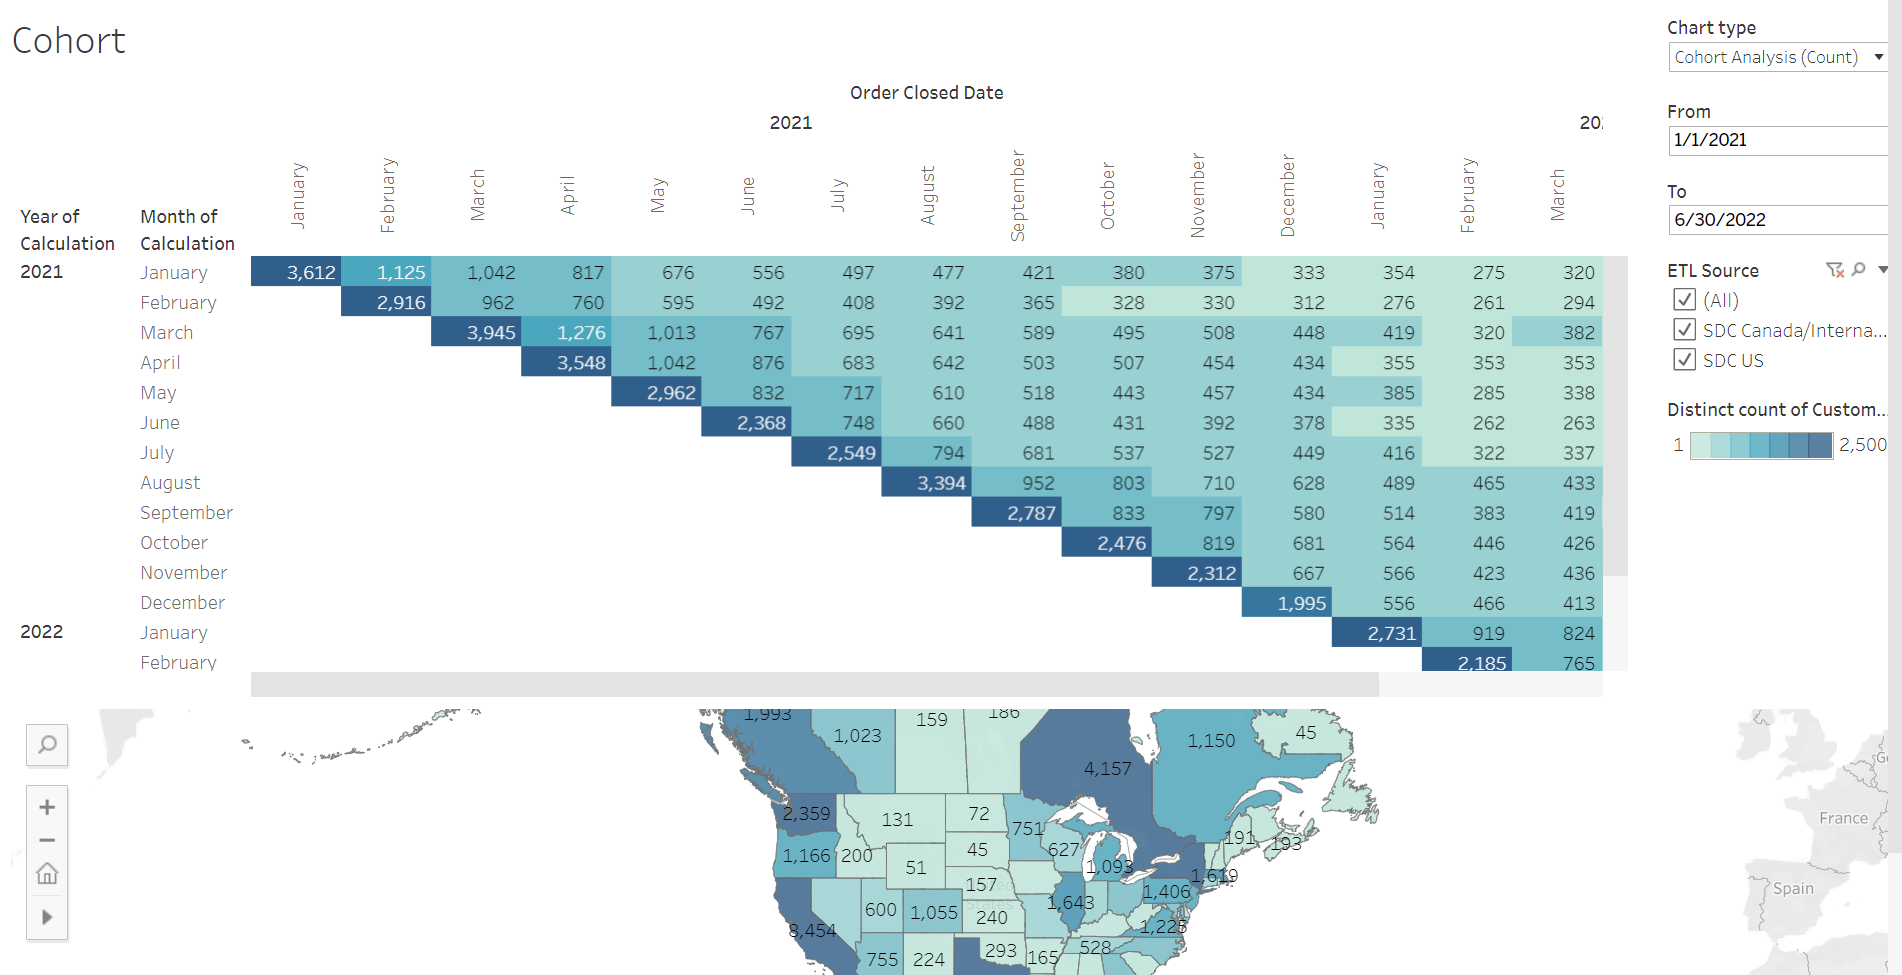
    • Average revenue per customer
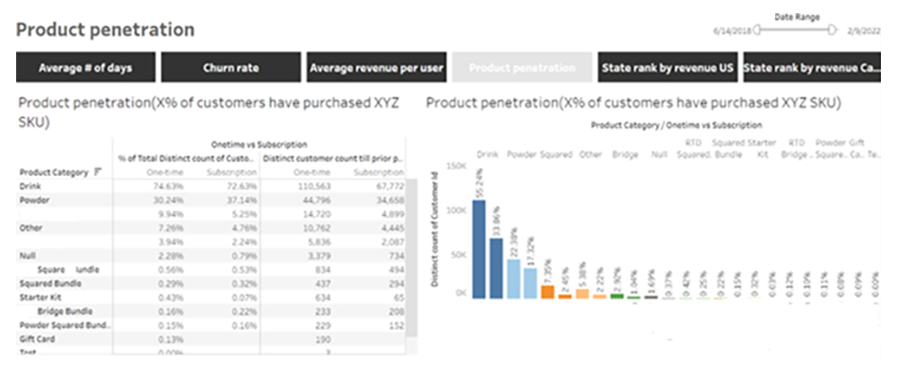
    • Product penetration by customer segment
    • Market basket analysis
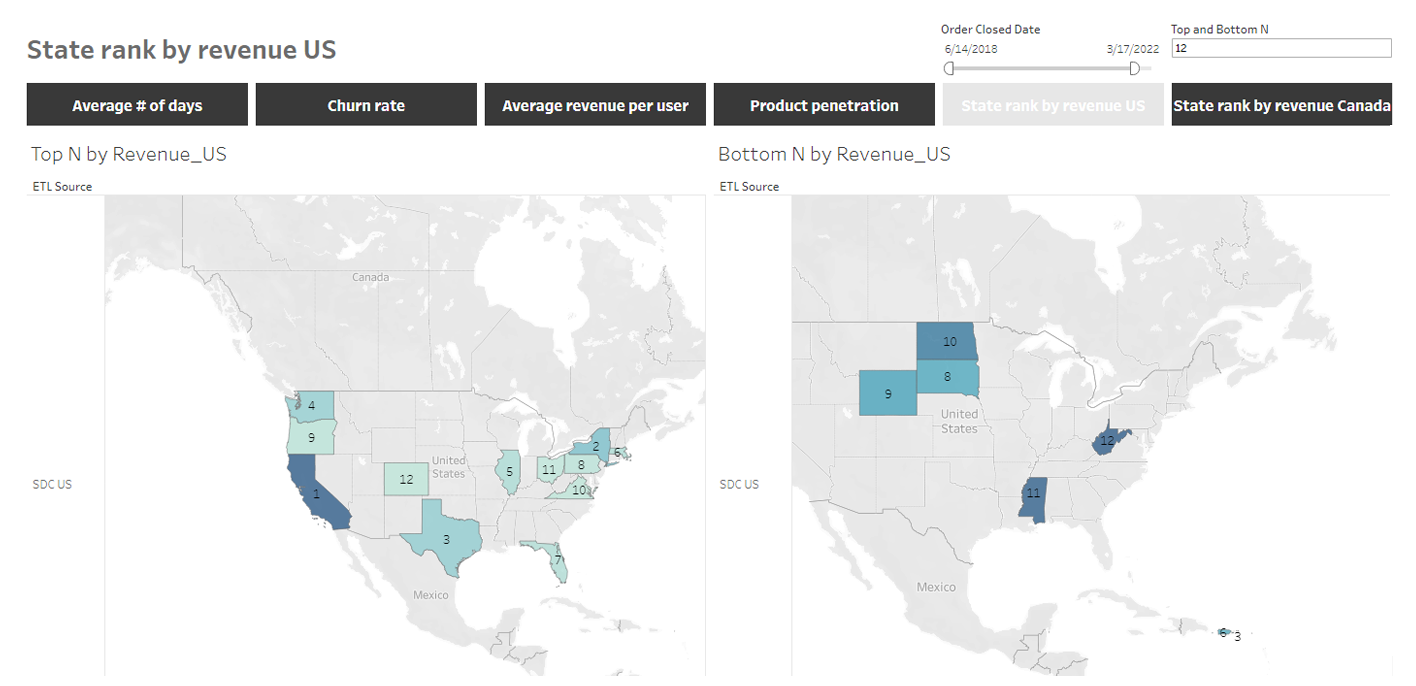
    • State rank by revenue - US and Canada
  • Financial analysis covered areas including –
    • Sales and Orders by Retail Customer month-to-date
    • MTD + Orders vs Budget
    • Full Month Estimate vs Forecast, Budget, and PY (prior year)
  • Visualizations were designed to identify hidden trends in the data

Business Benefits Business Benefits

  • The solution was designed in such a manner that it helped extract data from multiple sources in an automated manner, thereby eliminating any human intervention and resulting errors..
  • The solution made it easy for the top management to gain critical insights into marketing. operational and financial data.

Sample analysis/ visualization

cohort


product penetration


state rank by revenue us